
CA FVRC Research Findings
The California Safety and Wellbeing Survey (CSaWS)
The California Safety and Wellbeing Survey (CSaWS) is a landmark web-based survey covering a wide range of topics related to safety, neighborhoods, firearms, and firearm violence in California.
CSaWS 1 (the first wave) was fielded in September and October 2018 by the UC Davis Violence Prevention Research Program (VPRP) with funding from the State of California for the UC Firearm Violence Research Center (UCFC).
The second wave of CSaWS was fielded in July 2020, amidst the COVID-19 pandemic, and collected information on perceptions of safety and worry about violence before and during the pandemic.
You can find links to CSaWS studies and fact sheets summarizing their results here.
_________
Findings in Peer-Reviewed Literature
August 2020 Spitzer, et al. Incidence, Distribution, and Lethality of Firearm Injuries in California From 2005 to 2015.
June 2020 Pallin, et al. Assessment of Extreme Risk Protection Order Use in California From 2016 to 2019.
November 2019 Wintemute, et al. Extreme Risk Protection Orders Intended to Prevent Mass Shootings: A Case Series.
May 2018 Pear, et al. Firearm mortality in California, 2000-2015: the epidemiologic importance of within-state variation.
_________
Presentation: Firearm Mortality in California, 2000-2015
The presentation below is based on data from the California Department of Public Health's Multiple Cause of Death data files.
You can download the slides and notes in PDF format.
 These slides were created by the University of California, Davis Violence Prevention Research Program and last updated in August 2018.
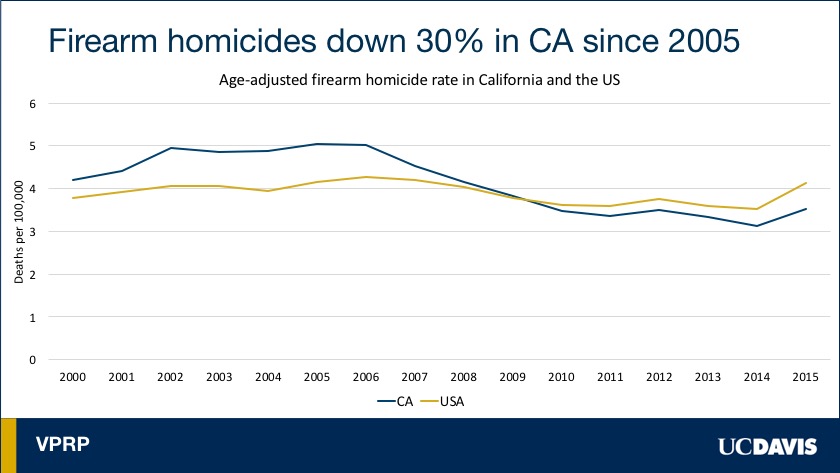 From 2000 to 2015, 48.9% of all firearm-related deaths in California were homicides, resulting in 24,922 deaths. Since 2005, when the rate peaked, there has been a 30% decline in firearm homicides. In comparison, the national rate declined 3% in the same period.
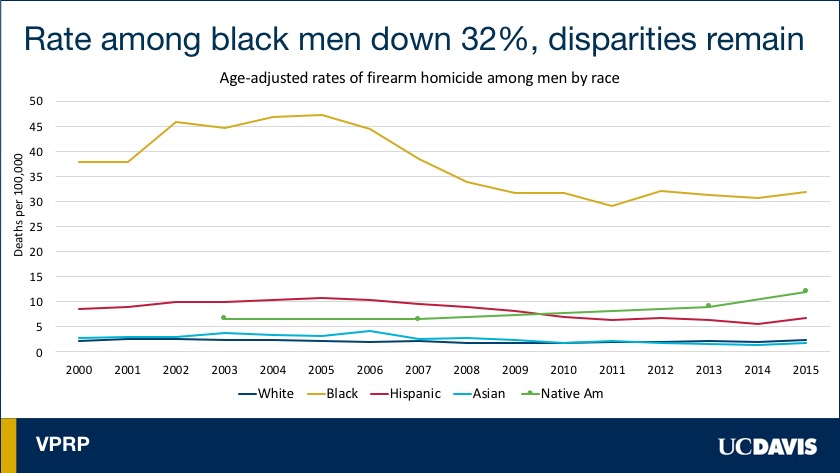 Consistent with national patterns, there were large differences in firearm homicide rates between men and women in California. On average over the study period, the rate for men was 7.2x that of women. There were also stark disparities in firearm homicide rates among men of different races/ethnicities. The average rate for black men was 4.5x the rate for Hispanic men, the group at next highest risk. Native American men have a dotted line in this and other graphs to indicate that the line is being interpolated over suppressed data points. Rates based on counts of fewer than 15 deaths could not be presented, so data for Native American men have been pooled for every two-year period to avoid this as much as possible. The sparse data make it hard to draw any conclusions, but Native American men are the only group with increasing rates of firearm homicide over the study period.
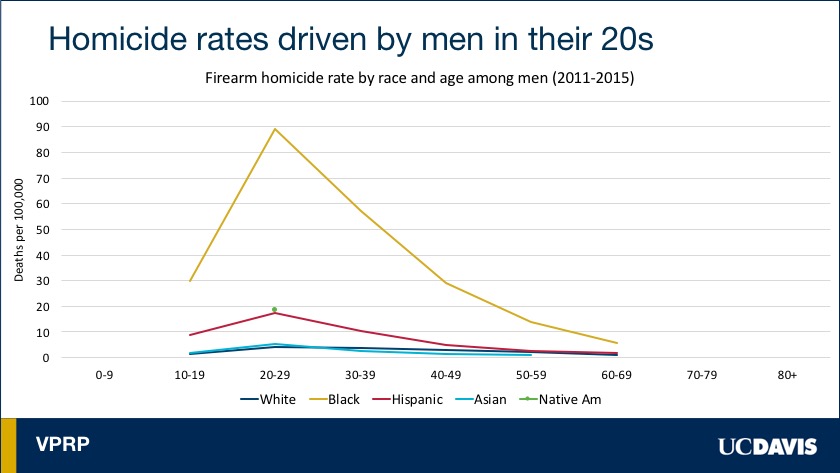 To explore differences within racial/ethic groups, rates among men by race and age were examined. Black men of all ages had the highest rate of firearm homicide, but the group rate is being driven by young men in their 20s, whose rate approached 90 per 100,000. The rate of firearm homicide among black men in their 20s was nearly 5 times (4.8x) higher than Native American men of the same age, who had the next highest rate.
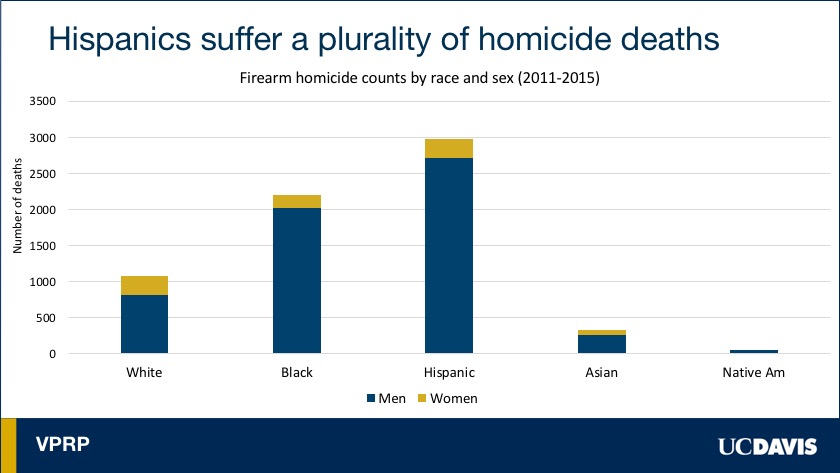 To get a complete picture of firearm homicide (or any health issue) it’s important to not only look at rates, which allow you to compare between groups of different sizes, but also at the absolute number of deaths in different groups. Hispanics had nearly 3 times (2.8x) the number of firearm homicides as whites, despite having nearly the same size population in California. Blacks had twice as many deaths as whites, but only 1/7th the population. (Population proportions: White=40%, Hispanic=38%, Asian=15%, Black=6%, Native Am=1%).
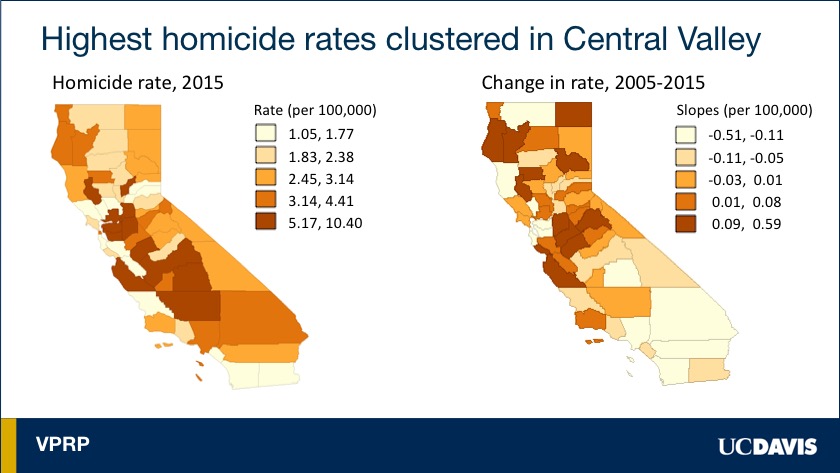 Turning to geographic variation in firearm homicide rates across counties: the map on the left shows county-level rates of firearm homicide in 2015, divided into quintiles. The light yellow counties are in the lowest quintile and the dark orange counties are in the highest quintile. Unexpectedly, the counties with the highest rates were clustered in the central valley and there was no significant difference in rates between urban and rural counties by 2015. The change in rates over time are displayed on the graph on the right. This graph shows quintiles of the average yearly change in rate per county from 2005 (the state peak) to 2015. The light yellow counties here had the greatest decline in firearm homicides, and the dark orange counties were those with the greatest increase. Rates in the most populous counties all declined, with Los Angeles County dropping a full 54% since 2002 (the county’s peak). This substantial decline in the county that 1 in 4 Californians call home drove the statewide decline in firearm homicide since the mid-2000s, and the decline in Los Angeles was itself driven by falling rates among black and Hispanic men.
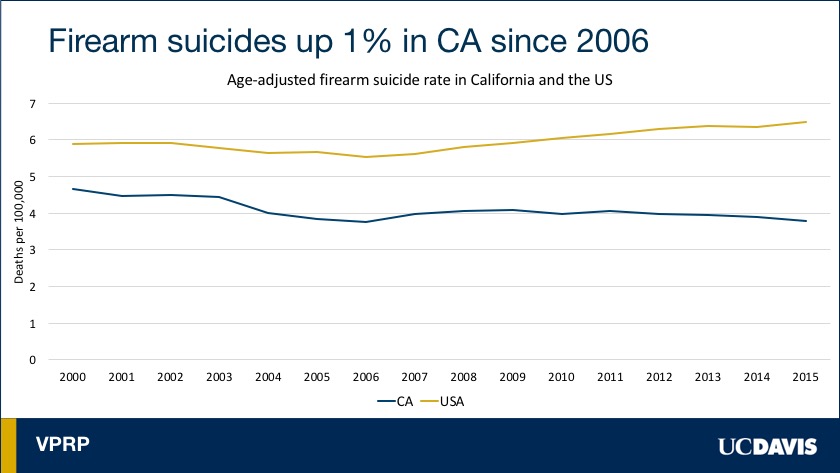 From 2000 to 2015, 46.5% of all firearm-related deaths in California were suicides, resulting in 23,682 deaths. The rate in California has consistently been lower than the national rate. Since the statewide low in 2006, the rate increased by about 1%. In comparison, the US rate increased 17% over the same period.
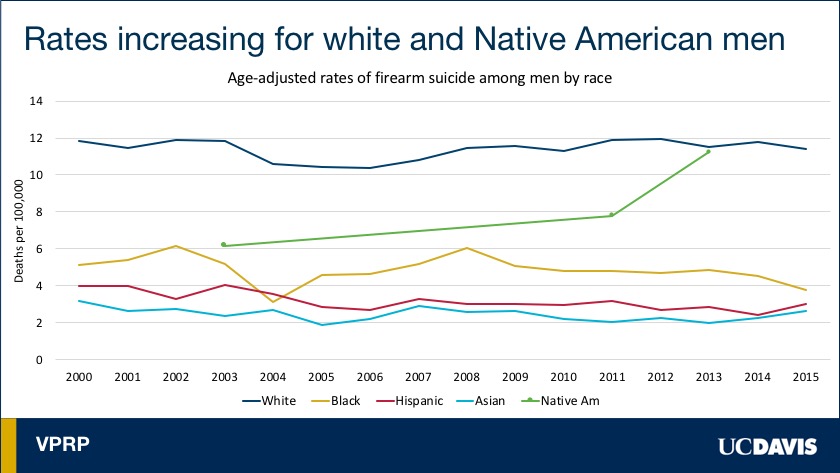 Similar to firearm homicide, we found substantial disparities in firearm suicide rates between men and women, with the rate among men 8.5x higher than the rate among women on average over the study period. There were further disparities among men by race. White men consistently had the highest rate of firearm suicide. Since 2006, the sitewide low, the rate increase 10% among white men. The rate among Native American men increased about 80% since the early 2000s, but again, sparse data make it hard to draw firm conclusions. In contrast, the rate for black went down by 37% since 2008 (the most recent group-specific peak).
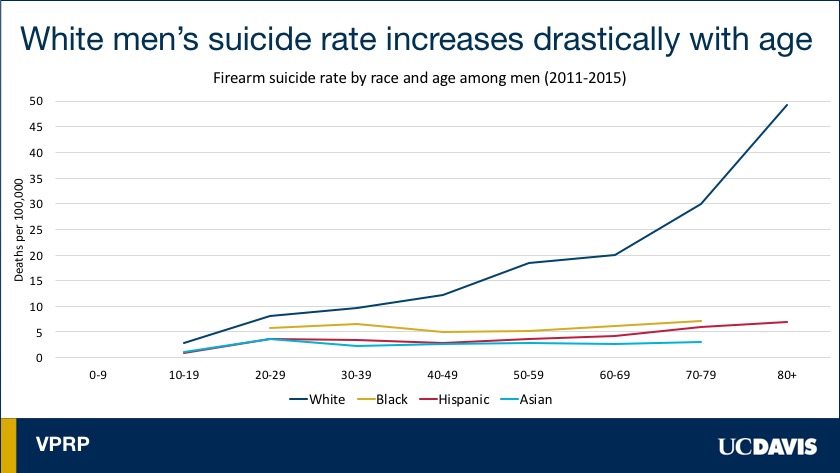 The rate of firearm suicide for white men increased drastically with age, following a much different trajectory over the life-course than any other racial/ethnic group. White men over 80 had a rate more than 5x that of Hispanic men, the group at next highest risk.
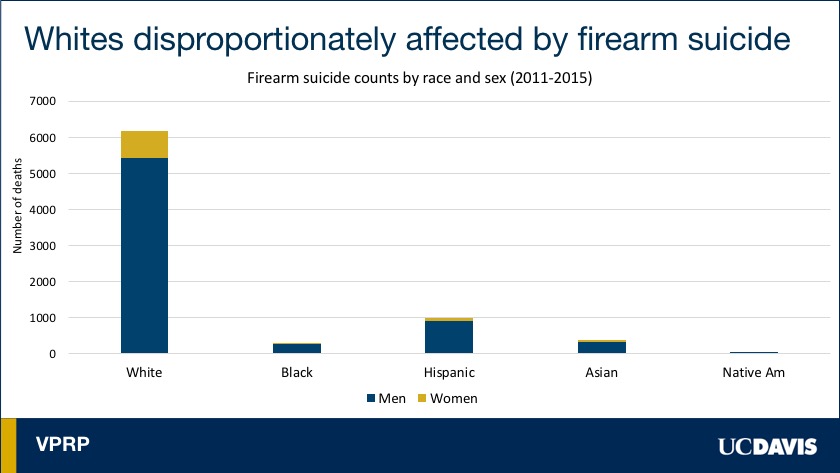 From 2011 to 2015, the number of deaths from firearm suicide among whites was more than 6x that of Hispanics, despite having roughly the same population size. (Population proportions: White=40%, Hispanic=38%, Asian=15%, Black=6%, Native Am=1%).
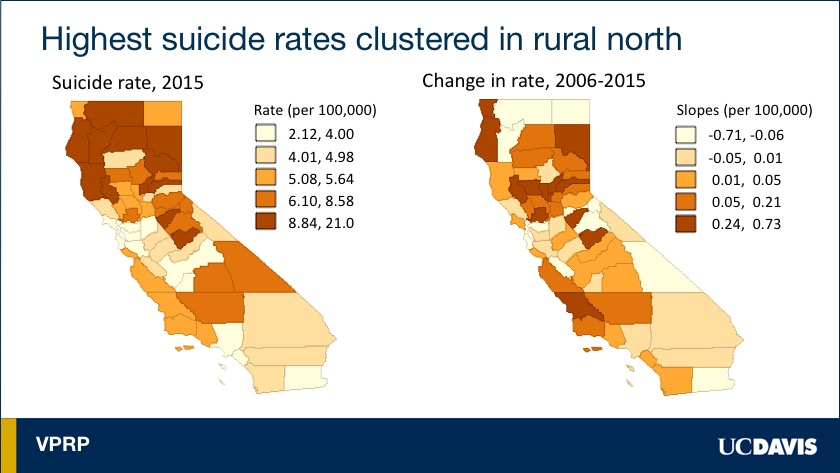 Turning to the geographic variation of firearm suicide rates by county: the graph on the left shows county-level rates in 2015, divided into quintiles. There was distinct clustering of the highest rates in the rural northern part of the state. In contrast, the lowest rates were in the most populous parts of the state: Los Angeles County and the Bay Area. Rates in nonmetropolitan counties were 3x higher than those in metropolitan counties, on average. The graph on the right shows the average annual change in rate since 2006, the statewide low. There did not seem to be a geographic pattern to the changes in firearm suicide rates. Overall, 38 counties increased since 2006 and 20 decreased.
 For more information, including trends and patterns of firearm mortality among women in California, see the full article in Annals of Epidemiology.