Figure 6. (-)-Xestospongin C, ryanodine, or dantrolene inhibit T cell proliferation and IL2 production
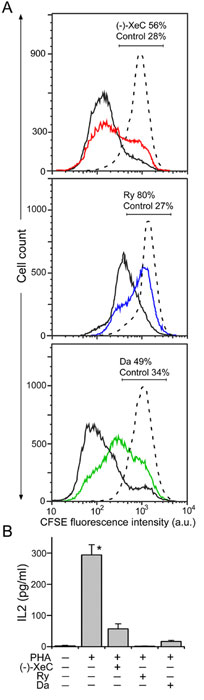
- The fluorescence profile of CFSE-loaded cells incubated for 72 hours in the presence of 10 μM (-)-XeC (top panel; red line), or 400 μM Ry (middle panel; blue line), or 30 μM dantrolene (lower panel; green line), or vehicles alone (control, black lines in all panels). The dashed lines show the fluorescence profile of CFSE-loaded cells incubated for overnight in FBS-deprived media (undivided cell population at time 0). The brackets and numbers above the brackets indicate an estimated fraction of undivided cells in control cell populations and cell populations incubated with (-)-XeC, or Ry, or dantrolene (Da). Representative data from five experiments performed with each blocker.
- IL2 content in cell culture supernatants. Cells were incubated for 24 hours in cell culture media supplemented with 20 μM PHA alone or in combination with (-)-XeC (10 μM), or Ry (400 μM), or dantrolene (Da; μ30 M), as indicated with (+); or vehicles alone, as indicated with (-). The (-)-XeC, or Ry, or dantrolene were applied 30 min prior to PHA. (*) indicates that differences between means are statistically significant at p < 0.01 (independent t test, n= 6).


 Make a donation using our secure online system.