
DXA body composition analysis
What is DXA?
The DXA, or "Dual X-ray Absorptiometry", is a quick and pain free scan that can tell you a lot about your body. It provides you with an in-depth analysis of your fat tissue, lean mass and bone density.
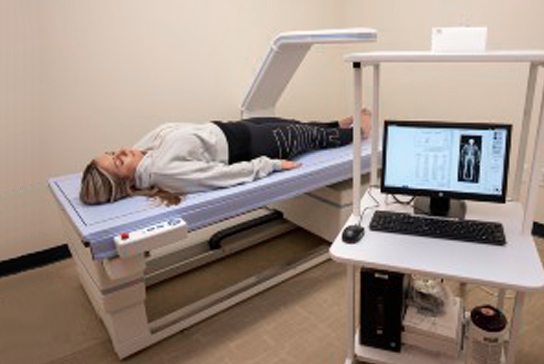
The DXA is a sleek, inconspicuous machine with an “arm” that branches out over the table that you lay on. Due to its open design patients can comfortably enjoy the test without feeling claustrophobic. It works by sending dual low power x-ray beams that can accurately and precisely differentiate between bone mineral, lean mass and fat mass.
Unlocking the Advantages of a DXA Scan
Understanding your body composition is crucial for optimizing health and fitness. A DXA (Dual-Energy X-ray Absorptiometry) scan provides a precise analysis of your body's primary components: fat, muscle, and bone*. Following your scan, you will receive an in-depth, multi-page report detailing percentages, mass, and annotated images illustrating the collected data.
Optimal Preparation for Accurate Results
To achieve the most reliable outcomes from your DXA scan, ensure you are well-hydrated and refrain from eating for at least three hours prior to the procedure.
What you are wearing can impact the scan, so first, minimize the metal. Watches, zippers, jewelry and underwires should be taken off prior to the scan. If it's implanted inside you, or a piece of jewelry that just isn't going to come off, that's ok! Lightweight clothing is optimal. Heavy sweatshirts and jeans should be avoided. We have paper shorts and/or gowns available to change in to if needed.
We cannot scan you if you may be pregnant. While the radiation is very minimal for an adult, it is not a good idea for a developing fetus. Also, avoid procedures that involve any sort of contrast dye for at least 2 weeks prior to your scan.
What to Expect During Your DXA Scan
Upon arrival at our medical facility, a licensed technologist will welcome and guide you through the process. Initial measurements of your height and weight will be taken, followed by a six-minute scan while you lie comfortably on the scanning bed.
Interpreting Your Results
Post-scan, you will have a consultation with an exercise specialist who will provide a detailed explanation of your body composition results. They will offer personalized recommendations based on your specific goals, whether you are focused on fat reduction, muscle growth, or bone density improvement*. You will also receive a comprehensive report for your records, and we can compared your results and monitor your progress with follow-up scans. (Ideally every 3-6 months for body composition and annually for bone density assessments*.)
Who Benefits from a DXA Scan?
A DXA scan is an invaluable tool for a broad range of individuals. Athletes can monitor muscle mass and body fat percentages, while anyone interested in their overall health can gain insightful information about their body composition. The information can help inform strategies for health and fitness improvements, while monitoring the results can help fine tune and optimize your intervention.
Schedule your DXA scan today to take a significant step toward understanding and optimizing your body composition.
*Not a diagnostic scan for bone density or osteoporosis risk.
What information can I get from a DXA Body Composition scan?
Total Body Fat Percentage (%BF): The percent of the body that is composed of fat. This will change based on the amount of fat there is as well as the amount of lean mass there is.
Fat Mass Index (FMI): The total amount of fat you have (in kilograms) relative to your height (in meters2). It is a measure of how much total fat you have, relative to your size and independent of lean mass.
Visceral Adipose Tissue (VAT): VAT is a hormonally active component of total body fat. The measurement reflects the amount of internal abdominal fat around the organs. This is different than subcutaneous fat, which lies beneath the skin. Increased VAT has a high correlation to cardiovascular and metabolic disease risk. Current research shows and elevated risk at around 100-160 cm2 and
Android to Gynoid Ratio: The “apple” to “pear” shape ratio. It describes where the fat is stored. Android (apple shape) refers to having most of the fat around the stomach and mid-section. Gynoid (pear shape) refers to having the fat stored around the hips. A bigger number means more android and a smaller number means more gynoid. From a health risk standpoint, ideal values are believed to be less than 0.8 for women and 1.0 for men.
Fat Free Mass Index (FFMI): The amount of mass that is not fat, relative to your height. This includes muscle, bone, organs and connective tissue. It can be used to gauge relative muscle mass in lean individuals.
Skeletal Muscle Mass (SMM): An estimate of the total amount of skeletal muscle you have. Because muscle has approximately the same density as other organs (liver, skin, etc…) and other types of muscle (heart, smooth muscle, etc…) we are not able to directly the amount of skeletal muscle you have. This is true of any commercially available body composition measurement (bioelectrical impedance, underwater weighing). However, several scientific studies have been performed that demonstrate good accuracy between our estimated SMM and that measured by MRI or CT scanning.
Skeletal Muscle Mass Percentage (%SMM): The percent of the body that is composed of skeletal muscle. Like %BF, this number is relative to your total mass.
Appendicular Lean Mass to Height Ratio (ALM/Height2): The amount of lean mass in the arms and legs relative to height. A low ALM/Ht2 is a risk factor for sarcopenia (low muscle mass), primarily in lean individuals. Cut points in research are generally around 5.5 for women and 7.0 for men.
Appendicular Lean Mass to BMI Ratio (ALM/BMI): The amount of lean mass in the arms and legs relative to Body Mass Index. This can also be used as a risk factor for sarcopenia and is more relevant than ALM/ht2 in overweight individuals. Cut points in research are generally around 0.51 for women and 0.79 for men.
Resting Metabolic Rate (RMR): The number of calories the body needs to maintain its current mass under resting conditions. The value provided by the DXA scan is estimated from the amounts of different tissues, and tissue specific metabolic rates. It can be thought of as the “ideal” RMR, given an individual’s body size and composition.
Whole-Body Bone Density: Shows the average bone density for your entire skeleton. It is not a diagnostic scan to assess the risk of osteopenia and osteoporosis, but can be used to identify systemic (whole-body) issues and track changes over time. The z-score compares your bone density to what is normal for people similar in age and body size. The t-score compares your bone density to that of a 30-year-old. Anything higher than -1.0 is representative of normal bone density. Between -1.0 and -2.5 is a risk for osteopenia. Anything under -2.5 is a risk for osteoporosis. A whole-body scan will not perform a detailed analysis of the fracture risk areas that a diagnostic scan will, and can therefore underestimate risk. We recommend following up with your primary care physician if you have concerns regarding bone density.