Alexander Ladenheim, M.D., Nam Tran, Ph.D., Baback Roshanravan, M.D., M.S., M.S.P.H., Brian Young, M.D.
Race and Health Disparities in Chronic Kidney Disease
Starting on May 4, 2021, UC Davis Health will calculate estimated glomerular filtration (eGFR) rate without a parameter for race. African Americans are at high risk for chronic kidney disease (CKD). The US Renal Data System (USRDS) 2018 Annual Report showed that black Americans in older age groups experienced higher rates of CKD compared to white Americans of similar age.1 This finding is also shared by the Jackson Heart Study, an epidemiologic study of black Americans in Mississippi, with the rate of CKD in this population close to 20%.2 Black Americans have a marked increased risk for end-stage renal disease (ESRD), with an age-sex-standardized incidence ratio of 2.9 compared to white Americans in 2016.3 Also troubling, black patients with ESRD exhibit a lower rate of kidney transplant compared to persons of other races.4 It is in this context that we need to reevaluate measures of kidney function that are estimated differently based on self-reported African American race.
Calculation of eGFR
The use of eGFR is an important clinical tool in the diagnosis of chronic kidney disease (CKD). Its primary role is to facilitate a simpler interpretation of biomarkers of renal disease, primarily creatinine and cystatin C. Currently, 89% of labs surveyed by the College of American Pathologists (CAP) report eGFR alongside serum creatinine.
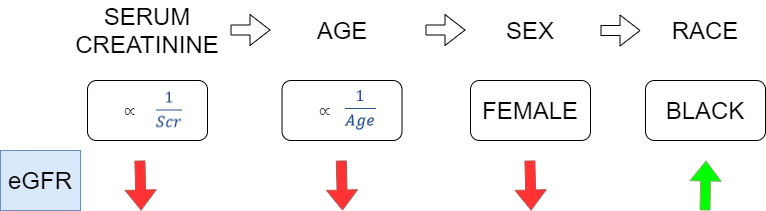
Several equations to calculate eGFR have been developed, with each iteration theoretically becoming more sensitive and specific for detecting CKD. The Modification of Diet in Renal Disease (MDRD) Study equation and the Chronic Kidney Disease Epidemiology Collaboration (CKD-EPI) equation are the most widely used equations for estimating GFR in adults. In each, regression models using serum creatinine and available demographic data helped to develop eGFR equations that correlated with measured GFR,5 with adjustments made for age, sex, and race (Figure 1).
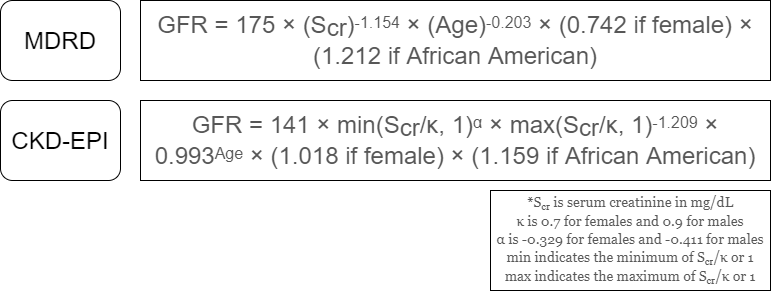
The MDRD equation (Figure 2), published in 1999, is still the most commonly used method to calculate eGFR, according to the 2018 CAP chemistry survey. One issue with the study is that the study population was predominately white and male (40% female, 80% white, 12% black).6
The CKD-EPI equation (Figure 2) was introduced 10 years later and is presently used at UC Davis Health for eGFR. Benefits of the CKD-EPI equation included having a larger and more diverse study cohort for the training and internal validation groups. However, races other than black or white represented a very small proportion of the study (6%), and the external validation group was less diverse (10% black, 87% white).7
Refuting the Race Parameter in the Calculation of eGFR
Several studies suggest that the equations used to calculate eGFR may overestimate GFR in black Americans, potentially leading to underdiagnosis of CKD. Data from the USRDS annual report8 and several recent studies9-10 show that black Americans have a higher prevalence of risk factors for CKD, such as hypertension, diabetes, and abnormal adjunct laboratory markers for renal disease despite a lower prevalence of CKD (eGFR < 60 mL/min) in this population as currently calculated. This implies that the use of eGFR alone as a screening tool may not be sensitive enough to find CKD in this population.
Race is a Social Construct with Limited Utility in Addressing Biologic Variability
A number of studies have examined the transferability of the eGFR equations to non-American black populations, such as populations in Democratic Republic of Congo, Ghana, and Ivory Coast. As noted in Omuse et al., the issue is not settled, and various studies have assessed the utility of the MDRD and CKD-EPI equations, with and without the race coefficient, for use in these populations with competing results.11 This in itself highlights the artificial nature of race as a social rather than biological construct and its limited utility as applied to estimating GFR. In fact, the race coefficient in the MDRD and CKD-EPI equations is presumably correcting for some other poorly characterized factor which raised the baseline serum creatinine levels in the persons in the training population for these two equations.
Although in clinical nephrology eGFR is not used in isolation to diagnosis CKD, Eneanya et al. succinctly points out the potential consequences of imprecision in eGFR in black persons, which include the way that drugs are administered or withheld based on eGFR, how quickly patients are referred to nephrology for the management of CKD, clinical trial eligibility, and access to renal transplant waitlists.
The authors also point out several flaws in the clinical categorization of race, including the nature of race as a social construct that does not correlate well to underlying genotypic or metabolic differences among persons. Race parameters in the calculation of eGFR do not account for persons who identify as multiracial or decline to answer clinicians’ questions about race. Further, clinicians may improperly assign race based on arbitrary phenotypic factors such as skin tone or hair.12 On the laboratory side, the problems of uncertainty in this arbitrary categorization are acknowledged in the way eGFR is currently reported, with values with and without the race coefficient simultaneously reported, leaving it for the clinicians to decide how to interpret eGFR in their patient’s case.13
Equations based on the measurement of serum levels of cystatin C have been developed and are being analyzed in various populations; for the purpose of comparability, there now exists a reference standard for cystatin C.14 The CKD-EPIcys equation mentioned earlier was developed in 2012. One advantage of cystatin C as a biomarker is that its levels are not dependent on an individual’s muscle mass or diet, and studies have borne out that race and body surface area need not be factored into equations utilizing cystatin C to calculate eGFR.15 There remain concerns about the accuracy of cystatin C, particularly in the setting of comorbid heart and liver disease which are both common in patients with CKD.16
Review of UC Davis Health Data
As part of the UCDH Working Group to address the question of using race in the calculation of eGFR, the Department of Pathology studied the feasibility of changing or eliminating the reporting of race from eGFR reporting. Approximately 1 month of serum creatinine values and corresponding eGFR data was obtained from Beaker, along with each patient’s age and sex, from 373 patients over age 18 who provided 497 specimens (range: 1-10 specimens per patient). Our findings showed, as expected, a higher prevalence of CKD as defined by eGFR < 60 mL/min/1.73m2 utilizing the eGFR equation without a race parameter (NAA equation) compared to the equation with the parameter for race (AA equation). Patients’ eGFRs were classified into subgroups corresponding to the major breakpoints in the staging of CKD (>90, 60-90, 30-60, and <30 mL/min/1.73m2). Our data showed that a large number of patients in higher risk groups would either be reassigned from stage 3 to stage 4 CKD, or reassigned from CKD-negative to CKD-positive, simply by removing the race parameter from the calculation of their eGFR.
The tests were compared in terms of positive and negative agreement17 to evaluate whether utilizing the NAA equation alone would be adequately sensitive (no missed cases of CKD) without adding too many new cases, which could either be cases of CKD that were previously missed or false positives. There was perfect positive agreement utilizing the NAA equation, analogous to 100% sensitivity. Negative agreement was 91.2% for males and 93.4% for females, meaning that overall only a relatively small number of patients were reassigned to CKD positive status. These cases, as noted above, could represent cases of CKD that would be missed if the AA equation was utilized to calculate eGFR. However, they could also represent false positives.
To determine what the impact of utilizing the NAA equation exclusively on this population might be, a chart review was performed on the patients who were CKD positive by the NAA equation but CKD negative by the AA equation. Risk factors for CKD, such as hypertension and diabetes were common among these patients. Other risk factors included inflammatory arthritis and other autoimmune diseases, renal donors, and renal transplant recipients. To summarize, many of the patients in this group with borderline eGFRs have significant risk factors for CKD and at the least warrant close follow-up.
A chart review was not performed on patients with higher eGFRs (> 60 mL/min). It is worth noting that the largest number of patients reassigned to a lower risk group by the AA equation were those with eGFRs between 60-90 mL/min as calculated by the NAA equation. It is unclear what the clinical consequences would be of reassigning these patients to the higher risk group by calculation with the NAA equation. Importantly and as noted earlier, eGFR is not diagnostic of CKD in isolation for patients with eGFRs > 60 mL/min. In clinical practice, nephrologists take a comprehensive look at the clinical picture, adjunct laboratory values, and trends in renal biomarkers/eGFR to determine the diagnosis of CKD.
Action Plan
The UCDH Working Group, with an eye to national standards being developed by a national working group addressing this same problem (National Kidney Foundation/American Society of Nephrology Task Force on Reassessing the Inclusion of Race in Diagnosing Kidney Disease), will change the reporting of calculated eGFR. A single eGFR calculated without the race parameter will be reported as a discrete value in the chart. Using this calculation is more sensitive for the detection of CKD. This supports the goal of narrowing some of the disparities in CKD, including the higher prevalence of CKD in African Americans compared to white patients, the higher rate of progression to ESRD, and transplant eligibility.
Additionally, in a comment, without perpetuating racial phenotypes, there is acknowledgement that eGFR based on creatinine may have person-to-person variability. A recommendation for alternate measures of GFR, such as cystatin C or measurement of kidney clearance, is given for situations in which more precision is desired. Acknowledging variability in creatinine-based calculations of eGFR will give the clinician the flexibility for shared decision making in initiating therapy in these patients, recommendation for transplant waiting lists, and ensuring clinical trial eligibility based on the patient’s overall clinical status instead of a single number.
Clinical Impact of these Changes
The change to a single eGFR value calculated by CKD-EPI without a parameter for race is intended to increase the sensitivity of the eGFR calculation for chronic kidney disease. From a practical standpoint, more patients will appear to have lower eGFRs than prior to this change by approximately 16%. For African-American patients, this may cause anxiety or concern over what an apparent new abnormal lab value. Patients should be reassured that although eGFR is important and useful in interpreting creatinine, the diagnosis of chronic kidney disease does not hinge on any single calculated eGFR, and that the entire clinical context, including medical history, medication history, and adjunct laboratory markers of renal disease are crucial to the diagnosis.
However, there are a number of clinical contexts in which this small change in eGFR can be of crucial importance. Patients being considered for renal transplant will be more likely to reach transplant threshold and in a shorter time when the race parameter is not used,18 as guidelines advise an eGFR threshold of <20 mL/min before moving to transplantation. On the other hand, the Kidney Donor Risk Index (KDRI) uses creatinine to predict the risk of graft failure in deceased donor renal allografts, and it also uses race independently in its calculation. African-American race has a hazard ratio of 1.196 in the KDRI calculation (approximately 20% increased risk of graft failure). However, a recent study suggested that race is, as in the case of eGFR, likely a ‘convenient’ substitute for some other poorly characterized negative prognostic factor. Julian et al. convincingly suggest that polymorphisms in apolipoprotein L1 (APOL1) may in part account for poorer outcomes in some allografts from African-American donors.19
Chronic renal disease frequently co-occurs with cardiac disease, and eGFR is a prognostic indicator and clinical predictor in patients with heart failure.20 Furthermore, measures of eGFR may influence the dosing and choice of medical therapy, as angiotensin-converting enzyme (ACE) inhibitors, angiotensin receptor blockers (ARBs), and mineralocorticoid receptor antagonists (MRAs) can cause increases in serum creatinine.21 However, patients are at risk of undertreatment if these medications are withheld due to small decreases in eGFR.22
In the case of acute kidney injury (AKI), it is worth considering that part of the definition of AKI involves a significant change in serum creatinine from the patient’s baseline. In the acute phase, estimates of GFR are not particularly useful as GFR does not decline in a linear fashion with the rise seen in serum creatinine. However, where eGFR has utility is establishing where the patient with AKI stood in terms of baseline renal function (prior to AKI), as the presence of CKD can have an increased risk of subsequent AKI and vice versa.23 With this reporting change, in African-American patients, some individuals with borderline eGFRs may now be classified as having CKD by the score without race parameter and this may influence management of AKI in the ED or inpatient setting.
Acknowledgements
We are grateful to Dr. Lydia Howell and all of the UCDH Working Group participants for their advice and coordination in developing the action plan and helping to make these changes possible.
References
- United States Renal Data System*. “Chapter 2: Identification and Care of Patients with CKD.” In 2018 USRDS annual data report: Epidemiology of kidney disease in the United States, vol. 1. National Institutes of Health, National Institute of Diabetes and Digestive and Kidney Diseases; 2018.
- Flessner M, Wyatt S, Akylbekova E et al. “Prevalence and Awareness of CKD Among African Americans: The Jackson Heart Study.” American Journal of Kidney Diseases 2009;53(2): 238-247.
- United States Renal Data System*. “Chapter 1:Incidence, Prevalence, Patient Characteristics, and Treatment Modalities.” In 2018 USRDS annual data report: Epidemiology of kidney disease in the United States, vol. 2. National Institutes of Health, National Institute of Diabetes and Digestive and Kidney Diseases; 2018.
- United States Renal Data System*. “Chapter 6: Transplantation.” In 2018 USRDS annual data report: Epidemiology of kidney disease in the United States, vol. 2. National Institutes of Health, National Institute of Diabetes and Digestive and Kidney Diseases; 2018.
- National Institute of Diabetes and Digestive and Kidney Diseases (NIDDKD). “Estimating Glomerular Filtration Rate.” (n.d.). Retrieved from https://www.niddk.nih.gov/health-information/professionals/clinical-tools-patient-management/kidney-disease/laboratory-evaluation/glomerular-filtration-rate/estimating. Accessed July 15, 2020.
- Levey A, Bosch J, Lewis J et al. “A More Accurate Method To Estimate Glomerular Filtration Rate from Serum Creatinine: A New Prediction Equation.” Ann Intern Med 1999;130(6):461-70.
- Levey A, Stevens L, Schmid C et al. “A New Equation to Estimate Glomerular Filtration Rate.” Ann Intern Med 2009;150(9): 604-612.
- United States Renal Data System*. “Chapter 1: CKD in the General Population.” In 2018 USRDS annual data report: Epidemiology of kidney disease in the United States, vol. 1. National Institutes of Health, National Institute of Diabetes and Digestive and Kidney Diseases; 2018.
- Peralta C, Lin F, Shlipak M et al. “Race differences in prevalence of chronic kidney disease among young adults using creatinine-based glomerular filtration rate-estimating equations.” Nephrology Dialysis Transplantation 2010;25(12): 3934-3939.
- Anker N, Scherzer R, Peralta C et al. “Racial disparities in creatinine-based kidney function estimates among HIV-infected adults.” Ethnicity and Disease 2016;26(2): 213-220.
- Omuse G, Maina D, Mwangi J et al. “Comparison of equations for estimating glomerular filtration rate in screening for chronic kidney disease in asymptomatic black Africans: A cross sectional study.” BMC Nephrology 2017;18(1): 369.
- Eneanya N, Yang W, Reese, P. “Reconsidering the Consequences of Using Race to Estimate Kidney Function.” JAMA 2019;322(2): 113-114.
- National Institute of Diabetes and Digestive and Kidney Diseases (NIDDKD). “Reporting Glomerular Filtration Rate.” (n.d.). Retrieved from https://www.niddk.nih.gov/health-information/professionals/clinical-tools-patient-management/kidney-disease/laboratory-evaluation/glomerular-filtration-rate/reporting. Accessed July 15, 2020.
- National Institute of Diabetes and Digestive and Kidney Diseases (NIDDKD). “Update on Cystatin C.” (n.d.). Retrieved from https://www.niddk.nih.gov/health-information/professionals/clinical-tools-patient-management/kidney-disease/laboratory-evaluation/glomerular-filtration-rate/update-cystatin-c. Accessed July 15, 2020.
- Levey A, Inker L, & Coresh J. “GFR estimation: From physiology to public health.” American Journal of Kidney Diseases 2014;63(5): 820-834.
- Levey A, Coresh J, Tighiouart H et al. “Measured and estimated glomerular filtration rate: current status and future directions.” Nature Reviews Nephrology 2020;16(1): 51-64.
- Food and Drug Administration (FDA). “Statistical Guidance on Reporting Results from Studies Evaluating Diagnostic Tests - Guidance for Industry and FDA Staff.” (March 2007). Retrieved from https://www.fda.gov/regulatory-information/search-fda-guidance-documents/statistical-guidance-reporting-results-studies-evaluating-diagnostic-tests-guidance-industry-and-fda. Accessed July 15, 2020.
- Zelnick LR, Leca N, Young B, et al. Association of the Estimated Glomerular Filtration Rate With vs Without a Coefficient for Race With Time to Eligibility for Kidney Transplant. JAMA Netw Open. 2021;4(1):e2034004. doi:10.1001/jamanetworkopen.2020.34004. PMID 33443583.
- Julian BA, Gaston RS, Brown WM, et al. Effect of Replacing Race With Apolipoprotein L1 Genotype in Calculation of Kidney Donor Risk Index. Am J Transplant. 2017;17(6):1540-1548. doi:10.1111/ajt.14113. PMID 27862962.
- Viswanathan G, Gilbert S. The cardiorenal syndrome: making the connection. Int J Nephrol. 2010;2011:283137. Published 2010 Oct 4. doi:10.4061/2011/283137. PMID 21151533.
- Scully P, Goldsmith D. The management of end-stage heart failure and reducing the risk of cardiorenal syndrome. Clin Med (Lond). 2013;13(6):610-613. doi:10.7861/clinmedicine.13-6-610. PMID 24298112.
- Chahal RS, Chukwu CA, Kalra PR, Kalra PA. Heart failure and acute renal dysfunction in the cardiorenal syndrome. Clin Med (Lond). 2020;20(2):146-150. doi:10.7861/clinmed.2019-0422. PMID 32188648.
- Makris K, Spanou L. Acute Kidney Injury: Diagnostic Approaches and Controversies. Clin Biochem Rev. 2016;37(4):153-175. PMID 28167845.
*The data reported here have been supplied by the United States Renal Data System (USRDS). The interpretation and reporting of these data are the responsibility of the author(s) and in no way should be seen as an official policy or interpretation of the U.S. government